Investing in stocks can feel overwhelming, especially with terms like “fundamental analysis” and “technical analysis” thrown around. Both methods help investors make decisions, but they approach the market differently. Let’s break them down with simple examples to help you choose the right strategy.

Table of Contents
What Is Fundamental Analysis?
Fundamental analysis evaluates a company’s true value by studying its financial health, industry trends, and economic conditions. Think of it like a medical check-up for a business: you’re diagnosing its strengths and weaknesses to decide if it’s worth investing in.
Key Components of Fundamental Analysis
- Financial Statements:
- Income Statement: It presents revenue, expenses, and profits.
- Balance Sheet: Lists assets (e.g., cash, property) and liabilities (e.g., loans).
- Cash Flow Statement: Tracks cash inflows and outflows.
For example, if Company A has ₹100 crore in revenue, ₹450 crore in debt, and ₹200 crore in net profit, you’d compare these numbers to competitors to gauge performance.
- Financial Ratios:
- Price to Earnings (P/E) Ratio: Stock price ÷ Earnings per share (EPS). A P/E of 17 means investors pay ₹17 for ₹1 of earnings.
- Debt to Equity Ratio: Total debt ÷ Shareholder equity. A ratio above 1 signals high debt risk.
- Macro Factors:
- Industry growth, government policies, and inflation rates.
Example of Fundamental Analysis
Imagine TechGrow Ltd., a tech start up:
- Revenue: ₹1,000 crore (up 20% YoY).
- Debt: ₹300 crore.
- EPS: ₹40.
- P/E Ratio: 15 (Stock price: ₹600 ÷ EPS of ₹40).
If the industry average P/E is 18, TechGrow might be undervalued, making it a potential buy.
Pros and Cons
| Pros | Cons |
| Identifies long-term value | Time-consuming (needs deep research) |
| Considers economic trends | Less effective for short-term trades |
| Reduces risk by assessing financial health | Subjective (e.g., judging management) |
What Is Technical Analysis?
Technical analysis focuses on price patterns and trends to predict future movements. It’s like studying weather patterns: you use historical data (charts) to forecast where a stock is headed, ignoring the company’s actual business.
Key Tools in Technical Analysis
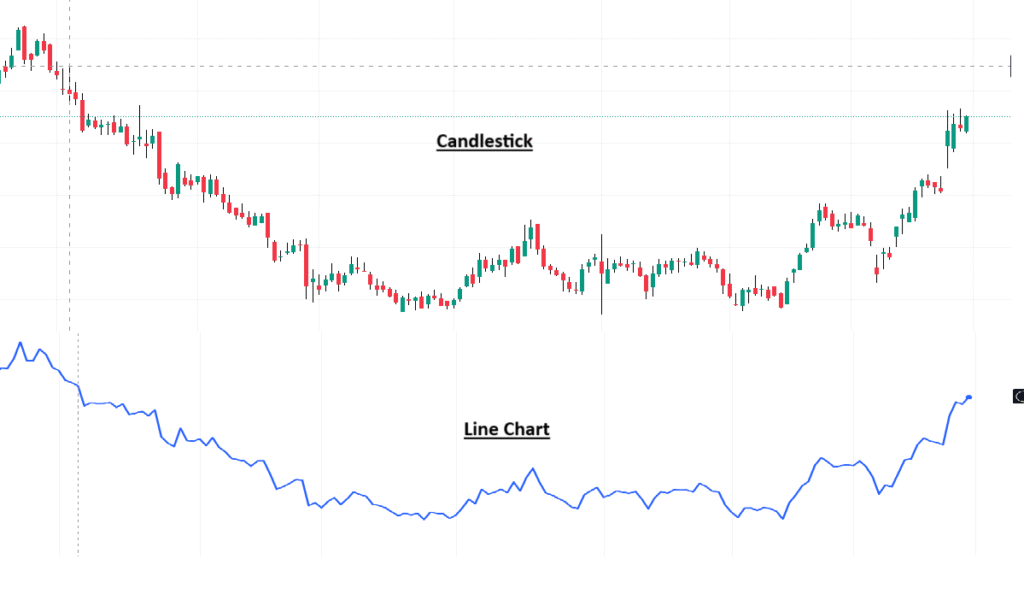
- Charts:
- Candlestick Charts: Show daily price movements (open, high, low, close).
- Line Charts: Track closing prices over time.
- Indicators:
- Moving Averages: Smooth out price fluctuations. A “golden cross” (50-day moving average crossing above 200-day) signals a bull trend.
- Relative Strength Index (RSI): Measures overbought (RSI >70) or oversold (RSI <30) conditions.
- Patterns:
- Head and Shoulders: Indicates a trend reversal.
- Support/Resistance Levels: Prices tend to bounce at certain levels (e.g., ₹1,000 support).
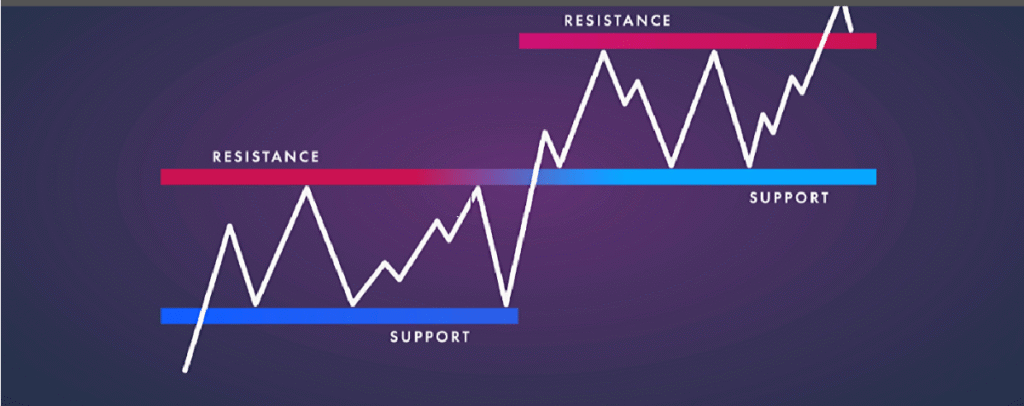
Example of Technical Analysis
Suppose RetailCo’s stock has traded between ₹750 (support) and ₹1,100 (resistance) for months. If it breaks above ₹1,100 on high volume, technical analysts might buy, expecting a rally.
Pros and Cons
| Pros | Cons |
| Quick decisions based on real-time data | Ignores company fundamentals |
| Works for short-term trading | Patterns can fail due to market noise |
| Easy to visualize with charts | Self-fulfilling prophecies (e.g., everyone acts on the same signal) |
Fundamental vs. Technical Analysis: Key Differences
| Factor | Fundamental Analysis | Technical Analysis |
| Focus | Company’s financial health | Price trends and charts |
| Time Horizon | Long-term (years) | Short-term (days/weeks) |
| Data Used | Financial statements, economic reports | Historical price and volume data |
| Best For | Value investors (e.g., Warren Buffett) | Day traders, swing traders |
| Limitations | Slow to reflect market changes | Doesn’t explain “why” prices move |
Which Should You Use?
- For Long-Term Investors:
- Use fundamental analysis to find undervalued companies with strong growth potential. Example: A pharma stock with a low P/E ratio and rising R&D spending.
- For Short-Term Traders:
- Use technical analysis to time entries and exits. Example: Buying a stock when its RSI drops below 30 (oversold).
- Hybrid Approach:
- Combine both! Use fundamentals to pick stocks and technicals to decide when to buy. For instance, buy a fundamentally strong stock only when it breaks out of a resistance level.
Final Thoughts
Neither method is “better”-they serve different goals. If you’re saving for retirement, fundamentals will guide you to stable companies. If you’re trading weekly, technicals help spot trends. Many pros blend both: for example, using P/E ratios to filter stocks and moving averages to time trades.
Actionable Tips:
- Start with fundamental analysis if you are new.
- Practice technical analysis with virtual trading apps.
- Follow quarterly earnings reports (fundamental) and watch for chart patterns (technical).
By understanding these two approaches, you will make smarter, confidence-driven investment decisions.